Building a Futuristic Neon Map Hub: A Deep Dive into Real-Time Data Integration
Empowering Navigation with Google Maps, Live Weather, and AQI Insights
The ultimate dashboard for modern travelers and tech enthusiasts.
1. Introduction: The Vision Behind the Hub
In an era where information is power, having a fragmented view of our surroundings is no longer enough. While traditional maps provide directions, they often lack the environmental context that modern life demands. I envisioned a "Location Intelligence Hub"—a single terminal that not only guides your route but monitors the world around you in real-time. This project is the culmination of that vision, blending cutting-edge web technologies with a stunning neon aesthetic to create a terminal that looks like it belongs in the year 2077.
2. Why This Project Matters?
Traditional navigation apps often require switching between multiple tabs—one for maps, one for weather, and another for air quality. This "Neon Hub" solves this by aggregating three critical data streams into one sleek dashboard. Whether you are a daily commuter in Dhaka or a traveler planning your next trip to Khulna or Chittagong, knowing the live traffic conditions, current temperature, and local Air Quality Index (AQI) simultaneously is a game-changer for health and efficiency.
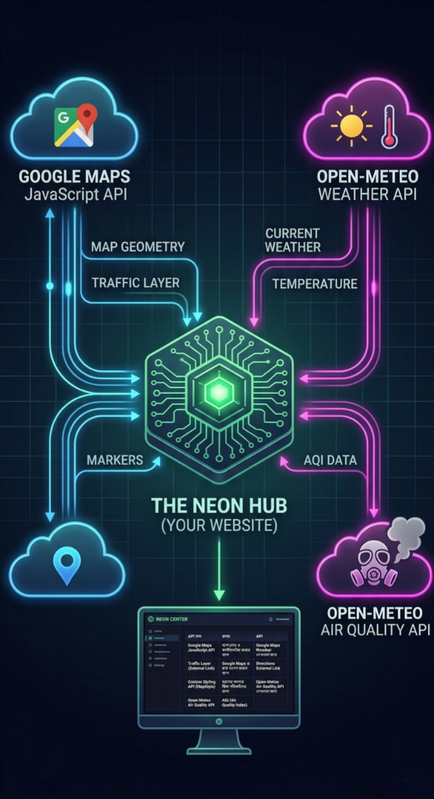
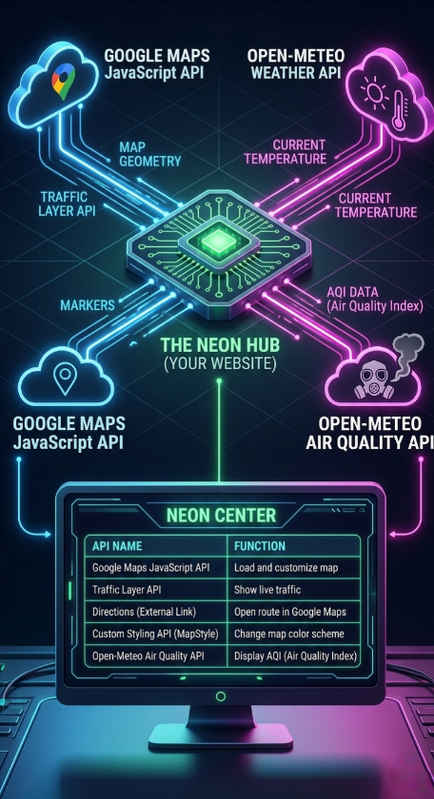
The technical architecture connecting APIs to the UI.
3. How It Works: The Invisible Engine
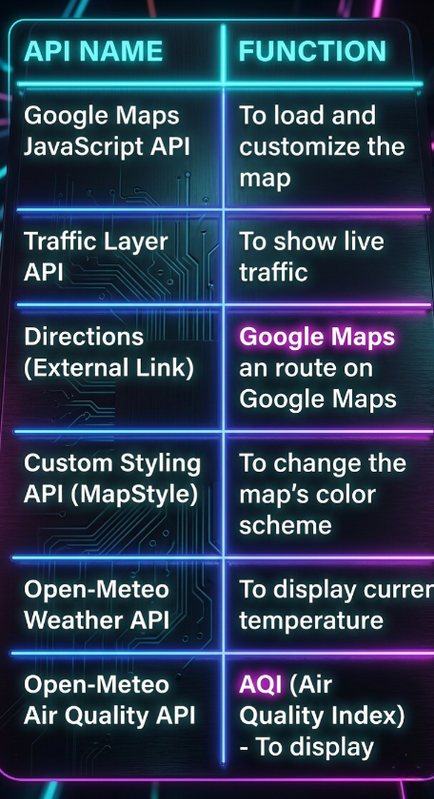
This application is more than just a pretty face; it's a sophisticated data-driven engine. The core logic relies on Asynchronous JavaScript and XML (AJAX) principles using the Fetch API. Here is how the components communicate:
- Google Maps JavaScript API: Serves as the base canvas, allowing custom styling to create that "Dark Mode" look while overlaying live traffic layers.
- Open-Meteo Weather API: A high-performance, open-source API that provides localized temperature data based on the exact coordinates of the hub.
- Open-Meteo Air Quality API: Fetches real-time pollutants and US-AQI values to ensure users are aware of environmental risks.
A look at the clean, modular JavaScript logic.
4. Deep Dive into Implementation
The UI Design Philosophy
The interface uses Glassmorphism—a design trend characterized by translucent backgrounds and blur effects. By using backdrop-filter: blur(20px), the control panel feels like a floating holographic screen over the map. The neon green (#00ff88) accents ensure that critical information pops against the dark background, maintaining high readability at night.
Modular Code Structure
I built the script to be modular. The initMap() function focuses solely on the canvas, while updateData() handles external API calls. This separation of concerns means you can easily swap the weather provider or add new map layers without breaking the entire system. For example, the use of String.fromCharCode(176) ensures the degree symbol renders correctly across all browsers without encoding issues.
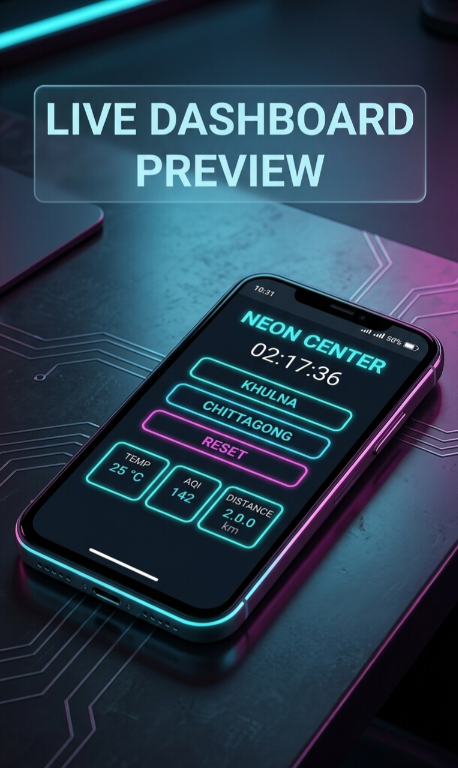
Live Application: NEON MAP HUB v1.0
Below is the functional terminal built using the architecture discussed above. It uses live API calls to fetch data for its central node.
5. Benefits and Advantages
Efficiency
Reduces data consumption and time by pulling only necessary metrics into one unified view.
Safety
Real-time AQI monitoring helps users with respiratory issues avoid high-pollution areas.
6. Conclusion: The Future of Navigation
This project is just the beginning. The architecture allows for future integrations like smart-home controls, autonomous vehicle tracking, or even localized news alerts. By harnessing the power of open APIs and modern web standards, we can transform a simple webpage into a powerful intelligence tool. I invite you to explore the script, customize the coordinates, and build your own version of the future.
Comments
Post a Comment